Patient Profiles: Understand the Person Behind the Data

Learn how modern medical monitoring uses contextual patient profiles and AI-supported oversight to detect risk sooner and protect patient safety.
Drug Interaction Visualizer: Explore Drug–Drug Safety Profiles

Explore drug–drug interactions using FDA adverse event data. Search, compare, and visualize potential risks when combining commonly prescribed medications.
Clinical Trials Global & Regional Insights Visualizer

Interactive visualizer showing global and country-level clinical trial activity and patient enrollment trends across regions from 2010 to 2022.
The Real Cost of Trial Delays & How RBQM Reduces Risk

Clinical trial delays are costly. Learn updated cost estimates and how RBQM + QbD make studies more predictable, efficient, and patient-focused.
Big Pharma Mergers and Acquisitions: Clinical Trials Visualizer

Interactive visualizer showing how major pharmaceutical mergers and acquisitions relate to clinical trial activity, R&D spending, and market trends over time.
Quality Tolerance Limits (QTLs) in Clinical Trials

Quality tolerance limits (QTLs) define when trial performance risks safety or data integrity. This guide explains the 7 most important QTLs under ICH E6(R3).
ICH E6(R3) Sponsor Responsibilities: What’s New and What It Means for You

Understand sponsor responsibilities under ICH E6(R3) and how to meet modern GCP expectations using risk-based, data-driven oversight.
R&D Efficiency: Big Pharma Overview
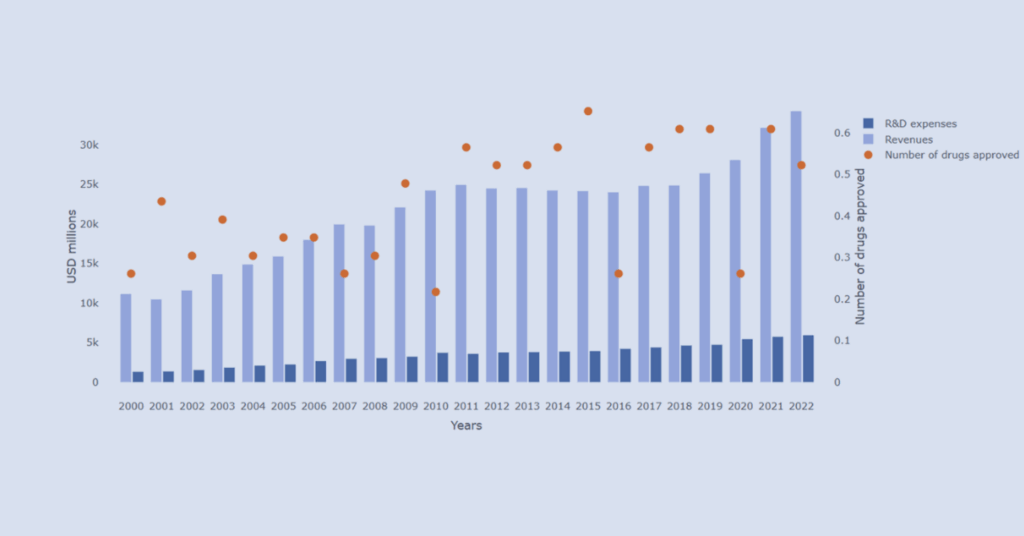
Explore R&D investment and innovation output across leading pharmaceutical companies through an interactive data visualizer.
Economy and Health Indicators Across OECD Countries
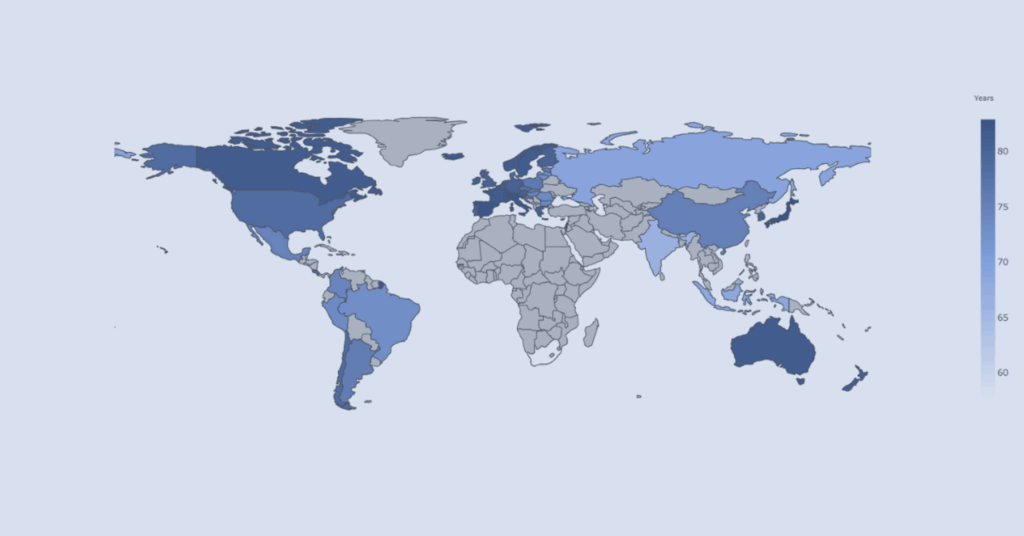
Interactive visualizer comparing economic indicators and health outcomes across OECD countries to support contextual understanding of population health trends.
Phase II Vanguards Visualizer

A structured view of Phase II clinical trials led by emerging pharmaceutical and research organizations.